Community Air Quality Monitoring: A Practical Guide to Low-Cost Sensors and Resident-Led Studies
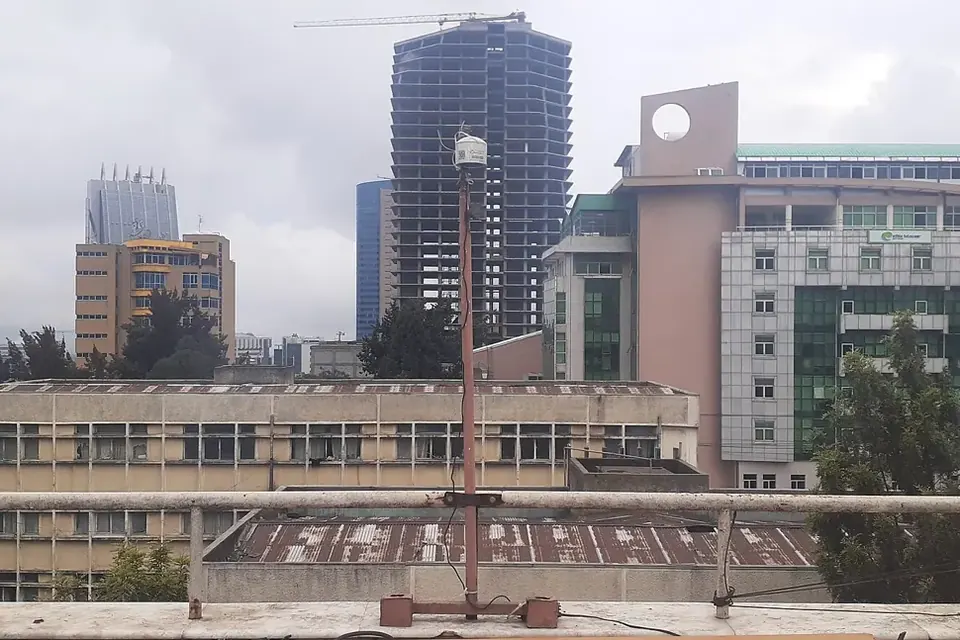
Air pollution varies from street to street, but official monitoring stations are few and far apart. Over the past decade, cheap sensors have made it possible for residents, schools and community groups to measure the air where they live. The data can be powerful, as long as everyone understands what the sensors can and cannot do.
Why communities monitor their own air
Regulatory monitoring networks are designed to check compliance with air quality standards over wide areas. They are not designed to show differences between a home next to a freight depot and one three streets away. Residents of neighbourhoods near highways, ports, industrial sites or busy construction often suspect that their exposure is higher than official averages suggest. Community monitoring lets them test that suspicion, document episodes such as smoke or dust events, and bring evidence to meetings with regulators and companies.
It is also one of the clearest examples of citizen science moving from contributory projects, where people host sensors for scientists, to co-created ones, where residents decide what to measure and why.
What low-cost sensors measure
| Pollutant | Typical low-cost technology | Main limitations |
|---|---|---|
| PM2.5 and PM10 (fine and coarse particles) | Optical sensors that count particles by light scattering | High humidity can make readings too high; coarse particles are often poorly detected; sensors age |
| Nitrogen dioxide (NO2) | Electrochemical cells or metal-oxide sensors | Sensitive to temperature, humidity and other gases; drift over months |
| Ozone (O3) | Electrochemical or metal-oxide sensors | Cross-sensitivity with NO2; needs frequent checking |
| Carbon dioxide (CO2), indoor | Non-dispersive infrared (NDIR) | Indicator of ventilation rather than of pollution as such |
For most community projects, PM2.5 is the most practical starting point: the sensors are relatively mature, and fine particles are strongly linked to health effects.
Reference points: standards and performance targets
Readings mean little without a yardstick. The World Health Organization's global air quality guidelines, updated in September 2021, recommend that annual mean PM2.5 concentrations should not exceed 5 micrograms per cubic metre and that 24-hour means should not exceed 15 micrograms per cubic metre more than three to four days a year. National legal limits are often higher than the WHO guideline values.
The US Environmental Protection Agency's Air Sensor Toolbox offers guidance for people buying and using sensors, and EPA has published performance targets and testing protocols for PM2.5 and ozone sensors (2021) and for other pollutants since. In California, the South Coast Air Quality Management District's AQ-SPEC programme has tested many commercially available sensors side by side with reference instruments and publishes the results.
Planning a monitoring project
- Start with a question. "Is the air worse near the depot than in the park?", "Do school drop-off times cause spikes?" and "How bad does indoor air get during wildfire smoke?" each require different designs.
- Choose sensors with published test results. Look for independent evaluations, not only manufacturer claims. Consider whether data are stored locally, sent to a cloud platform, or both, and who owns them.
- Site the sensors carefully. Typical advice is to mount outdoor sensors away from immediate local sources (a barbecue, a dryer vent), at breathing height or slightly above, with free air flow, protected from direct rain and sun, and away from walls that block air movement. Record exact locations and photographs of every site.
- Collocate. Before and ideally after deployment, run sensors next to a regulatory monitor or a calibrated reference instrument for several weeks. Use the comparison to derive a correction and estimate error.
- Collect long enough. A few days rarely show patterns. Seasons, weather and traffic changes matter.
- Analyse with care. Remove obvious faults, apply corrections, compare sites over the same periods, and look at hourly patterns and episodes rather than single readings.
- Report honestly. State the sensor type, corrections applied, uncertainty and gaps. Present findings to residents first, then to decision-makers.
Our article on data quality in citizen science covers these checks in more general terms.
Correction: why raw readings mislead
Optical particle sensors infer mass from particle counts and assumptions about particle properties. Humidity causes particles to absorb water and appear larger, so raw readings often overestimate PM2.5 on damp days. EPA researchers developed a nationwide correction for one widely used brand of community sensor, and the agency displays corrected sensor data on its AirNow Fire and Smoke Map alongside regulatory monitors. Projects should never present raw readings as if they were regulatory values.
From data to action
Community monitoring has shaped policy. California's Assembly Bill 617, signed in 2017, created the Community Air Protection Program, under which the California Air Resources Board selects communities with high cumulative exposure burdens for community air monitoring and emissions reduction programmes developed with residents. West Oakland, where residents and community organisations had documented diesel pollution for years, was among the first communities selected in 2018.
Elsewhere, residents have used sensor data to argue for traffic changes outside schools, enforcement against idling trucks, and better ventilation in homes and classrooms. The common thread is that data alone rarely change decisions: they work when combined with organising, official data and relationships with the agencies concerned.
Ethics and data sharing
- Sensors placed at homes reveal approximate addresses; publish locations at a resolution residents have agreed to.
- Indoor monitoring can reveal information about household activities. Agree who sees indoor data.
- Results can affect property values or tenants' relations with landlords. Discuss these risks before publishing street-level findings.
- Decide in advance whether raw data will be published openly, as our guide to open and community data discusses.
Sources
- World Health Organization, WHO global air quality guidelines: particulate matter (PM2.5 and PM10), ozone, nitrogen dioxide, sulfur dioxide and carbon monoxide, 2021.
- US Environmental Protection Agency, Air Sensor Toolbox; Performance Testing Protocols, Metrics, and Target Values for Fine Particulate Matter Air Sensors, 2021.
- South Coast Air Quality Management District, Air Quality Sensor Performance Evaluation Center (AQ-SPEC).
- California Assembly Bill 617 (2017); California Air Resources Board, Community Air Protection Program.
 Citizen science & data
Data quality in citizen science
Protocols, training, validation, consensus and statistics: the toolkit that makes volunteer data usable by scientists and regulators.
 Citizen science & data
What is citizen science?
From the 1900 Christmas Bird Count to online galaxy classification: definitions, history and the main models of public participation in science.
 Citizen science & data
Open and community data, shared responsibly
Report-back to participants, open licences, anonymisation and repositories: a practical guide to sharing community research data without harm.