Online Citizen Science: How Volunteer Classifications Become Research Data
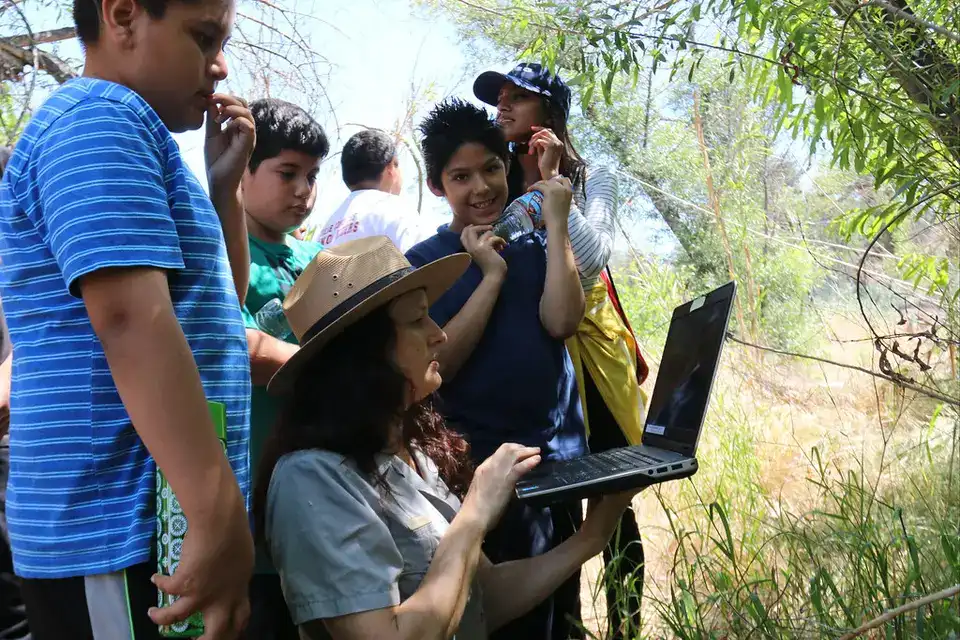
Some of the largest citizen science projects never send anyone outdoors. Volunteers sit at a laptop or a phone and look at images that researchers cannot get through on their own: galaxies, animals caught by camera traps, cells under a microscope, handwritten ship logs. Each person answers a few simple questions about each image, and software turns millions of these answers into a dataset. This guide explains how that works, how reliable the results are, and what a team needs to decide before asking the public for help.
Where it started
The model took shape with Galaxy Zoo, launched by astronomers at the University of Oxford in 2007. Survey telescopes had photographed far more galaxies than professional astronomers could inspect, and computers of the time were poor at telling a spiral galaxy from an elliptical one. The team put images from the Sloan Digital Sky Survey online and asked the public to sort them.
The first results paper, by Chris Lintott and colleagues, reported more than 40 million individual classifications made by about 100,000 participants, covering nearly one million galaxies (Lintott et al., Monthly Notices of the Royal Astronomical Society, 2008). The authors found that the volunteers' results were consistent with classifications made by professional astronomers for subsets of the same galaxies.
Volunteers also noticed things nobody had asked them to look for. The best known is Hanny's Voorwerp ("Hanny's object" in Dutch), a glowing cloud of gas next to the galaxy IC 2497, named after Hanny van Arkel, the volunteer who spotted it. A follow-up paper in 2009 argued that it might be the first detected "light echo" of a quasar. The discovery came through the project's discussion forum, which is one reason online platforms still pair the classification interface with a space where volunteers can talk to each other and to the scientists.
Galaxy Zoo grew into the Zooniverse, which describes itself as the world's largest platform for people-powered research, with projects across the sciences and humanities. It is one of several such platforms; the broader history of public participation in science, from bird counts onward, is covered in what is citizen science?
How a project is built
Platforms use a common vocabulary. A subject is one item to examine: an image, a short video, a page of text or a sound clip. A workflow is the sequence of tasks a volunteer completes for each subject, such as answering a multiple-choice question, drawing a box around an animal or transcribing a line of text. A classification is one volunteer's complete set of answers for one subject.
The Zooniverse help pages describe the main decisions a research team makes in its Project Builder:
- Tasks. Questions should be answerable by a non-specialist after a short tutorial. Complex judgements are split into several simple ones.
- Retirement. A subject is "retired", taken out of circulation, once enough people have classified it. For tagging what appears in an image, where a diversity of opinion is useful, the help pages suggest a retirement limit of 5 to 10 people; for full-text transcription, where the aim is to capture exactly what is on the page, they suggest a lower limit such as 3 or 5, together with very clear instructions.
- Exports. The team downloads its data as CSV files, including one row for every classification submitted, with information about the subject and the workflow version.
The platform also sets conditions. At the time of writing, the Zooniverse says it provides the Project Builder software and hosting free of charge. A project that wants to be listed and promoted as an official Zooniverse project must pass a review by the Zooniverse team and a beta test by volunteers, which lasts a week; the team must analyse the beta classifications to check that the results are good enough for its research before launch (Zooniverse, project review and policies).
From many answers to one result
No single volunteer's answer is treated as the truth. The reliability of online citizen science comes from redundancy: several independent people look at the same subject, and an aggregation method combines their answers.
Snapshot Serengeti, a Zooniverse project run with the University of Minnesota, is one of the best-documented examples. Its data paper, published in Scientific Data in 2015, describes 225 camera traps across 1,125 square kilometres of Serengeti National Park in Tanzania, which had produced 1.2 million sets of pictures by 2013. More than 28,000 registered volunteers contributed 10.8 million classifications, recording the species, the number of animals, their behaviour and the presence of young (Swanson et al., Scientific Data, 2015).
The project's retirement rules show how redundancy and efficiency are balanced. An image set was retired as blank if its first five classifications said "nothing here", as a consensus once ten volunteers had given the same species, or as complete after 25 classifications regardless of agreement. A simple plurality rule, the most common answer wins, then produced a final classification for each image, together with measures of how strongly volunteers agreed.
How accurate is it?
The Snapshot Serengeti team compared the consensus with a "gold standard" of 4,149 image sets classified by experts. The algorithm's answer agreed with the experts' species identification in 96.6% of cases and with their count of animals in about 90% of cases. Accuracy depended on the task: volunteers were more than 97% accurate when counting a single animal and least accurate when distinguishing between 5 and 10 individuals.
The authors drew two practical lessons. First, some ecological analyses need higher accuracy than 97%, so users of the data should take that into account. Second, the agreement measures are useful in themselves: images where volunteers disagreed are the hard ones, and they can be sent for expert review or excluded. That approach, using expert time only where the crowd is uncertain, is one of the validation strategies described in our guide to data quality in citizen science.
Not every task aggregates as neatly. Free-text transcription is harder to combine than a choice between species, and the Zooniverse help pages note that the platform does not currently offer aggregated classifications for text subjects: research teams receive each volunteer's transcription and must reconcile them themselves.
Before you launch: questions for a research team
- Is the task really suited to non-specialists? Try it on colleagues and friends with only the tutorial to help them. If they hesitate on most subjects, split or simplify the task.
- How will answers be combined? Decide the aggregation method and the retirement limit before launch, and test both on the beta data against an expert-classified sample.
- What will happen to the data? Volunteers give their time to a dataset; say whether and how it will be published, under what licence and with what credit. Our guide to open and community data covers the choices.
- Who will answer the forum? Volunteers ask questions and notice unexpected things. A project where nobody from the team replies loses both goodwill and discoveries.
- How will volunteers hear about results? Publications, blog posts and newsletters that report what the data showed are part of the deal, not an optional extra.
Contributory, not participatory
Online classification projects are almost always contributory: scientists set the question, design the tasks and analyse the data, while volunteers supply effort and attention. That is a legitimate and productive model, but it is different from community-led research, where the people affected help decide what is studied and why. Teams that want volunteers to have more influence can open up parts of the process, for example by inviting them to propose follow-up questions from the forum or to help interpret unusual finds. Judging honestly where a project sits is the purpose of the participation typologies discussed in our article on Arnstein's ladder.
Sources
- Chris J. Lintott, Kevin Schawinski, Anže Slosar and colleagues, "Galaxy Zoo: morphologies derived from visual inspection of galaxies from the Sloan Digital Sky Survey", Monthly Notices of the Royal Astronomical Society, vol. 389, 2008 (doi:10.1111/j.1365-2966.2008.13689.x).
- Chris J. Lintott and colleagues, "Galaxy Zoo: 'Hanny's Voorwerp', a quasar light echo?", Monthly Notices of the Royal Astronomical Society, vol. 399, 2009 (doi:10.1111/j.1365-2966.2009.15299.x).
- Alexandra Swanson, Margaret Kosmala, Chris Lintott, Robert Simpson, Arfon Smith and Craig Packer, "Snapshot Serengeti, high-frequency annotated camera trap images of 40 mammalian species in an African savanna", Scientific Data, vol. 2, 150026, 2015 (doi:10.1038/sdata.2015.26).
- Zooniverse Help, "How to create a project with our Project Builder", "How to launch your project and Zooniverse policies" and "Data exports", consulted 13 November 2026.
 Citizen science & data
Data quality in citizen science
Protocols, training, validation, consensus and statistics: the toolkit that makes volunteer data usable by scientists and regulators.
 Citizen science & data
What is citizen science?
From the 1900 Christmas Bird Count to online galaxy classification: definitions, history and the main models of public participation in science.
 Citizen science & data
Open and community data, shared responsibly
Report-back to participants, open licences, anonymisation and repositories: a practical guide to sharing community research data without harm.